Authors:
Anat Pardo¹⁺², Shiri Barbash-Hazan¹⁺², Shir Nachum¹⁺², Anat Shmueli¹⁺², Or Lee Rak¹⁺², Emillie Klochendler Frishman¹⁺², Hadas Zafrir Danieli¹⁺², Ronit Shtrichamn³, Shmuel Azulay³, Eran Hadar¹⁺²
Affliations:
1. Helen Schneider Hospital for Women Rabin Medical Center Beilinson,
2. Hospital Faculty of Medicine, Tel Aviv University, Israel,
3. Pulsenmore LTD, Israel
Objective:
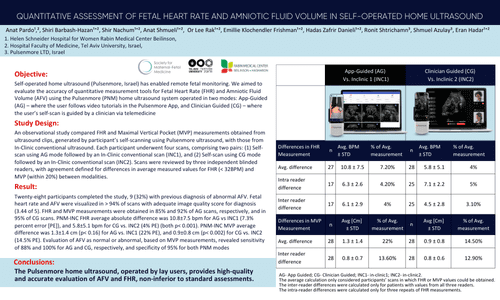
Self-operated home ultrasound (Pulsenmore, Israel) has enabled remote fetal monitoring. We aimed to evaluate the accuracy of quantitative measurement tools for Fetal Heart Rate (FHR) and Amniotic Fluid Volume (AFV) using the Pulsenmore (PNM) home ultrasound system operated in two modes: App-Guided (AG) – where the user follows video tutorials in the Pulsenmore App, and Clinician Guided (CG) – where the user’s self-scan is guided by a clinician via telemedicine
Study Design:
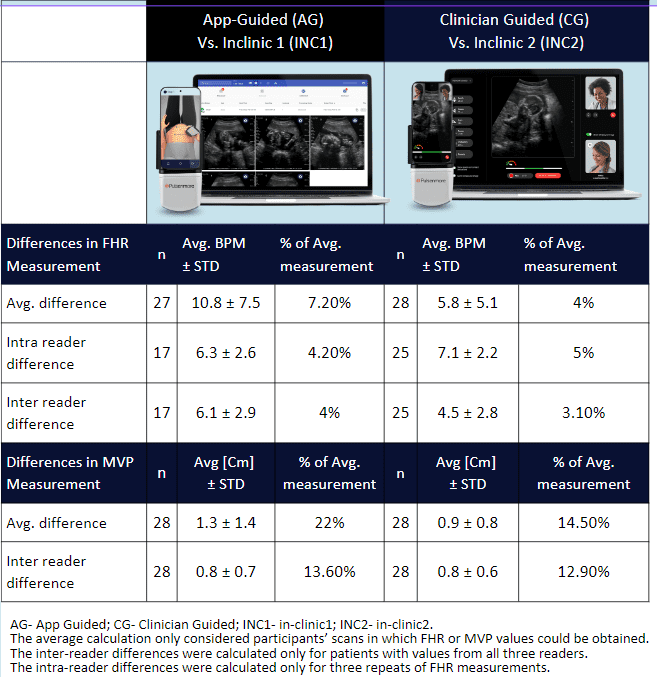
An observational study compared FHR and Maximal Vertical Pocket (MVP) measurements obtained from ultrasound clips, generated by participant’s self-scanning using Pulsenmore ultrasound, with those from In-Clinic conventional ultrasound. Each participant underwent four scans, comprising two pairs: (1) Self-scan using AG mode followed by an In-Clinic conventional scan (INC1), and (2) Self-scan using CG mode followed by an In-Clinic conventional scan (INC2). Scans were reviewed by three independent blinded readers, with agreement defined for differences in average measured values for FHR (< 32BPM) and MVP (within 20%) between modalities.
Results:
Twenty-eight participants completed the study, 9 (32%) with previous diagnosis of abnormal AFV. Fetal heart rate and AFV were visualized in > 94% of scans with adequate image quality score for diagnosis (3.44 of 5). FHR and MVP measurements were obtained in 85% and 92% of AG scans, respectively, and in 95% of CG scans. PNM-INC FHR average absolute difference was 10.8±7.5 bpm for AG vs INC1 (7.3% percent error [PE]), and 5.8±5.1 bpm for CG vs. INC2 (4% PE) (both p< 0.001). PNM-INC MVP average difference was 1.3±1.4 cm (p< 0.16) for AG vs. INC1 (22% PE), and 0.9±0.8 cm (p< 0.002) for CG vs. INC2 (14.5% PE). Evaluation of AFV as normal or abnormal, based on MVP measurements, revealed sensitivity of 88% and 100% for AG and CG, respectively, and specificity of 95% for both PNM modes
Conclusion:
The Pulsenmore home ultrasound, operated by lay users, provides high-quality and accurate evaluation of AFV and FHR, non-inferior to standard assessments.